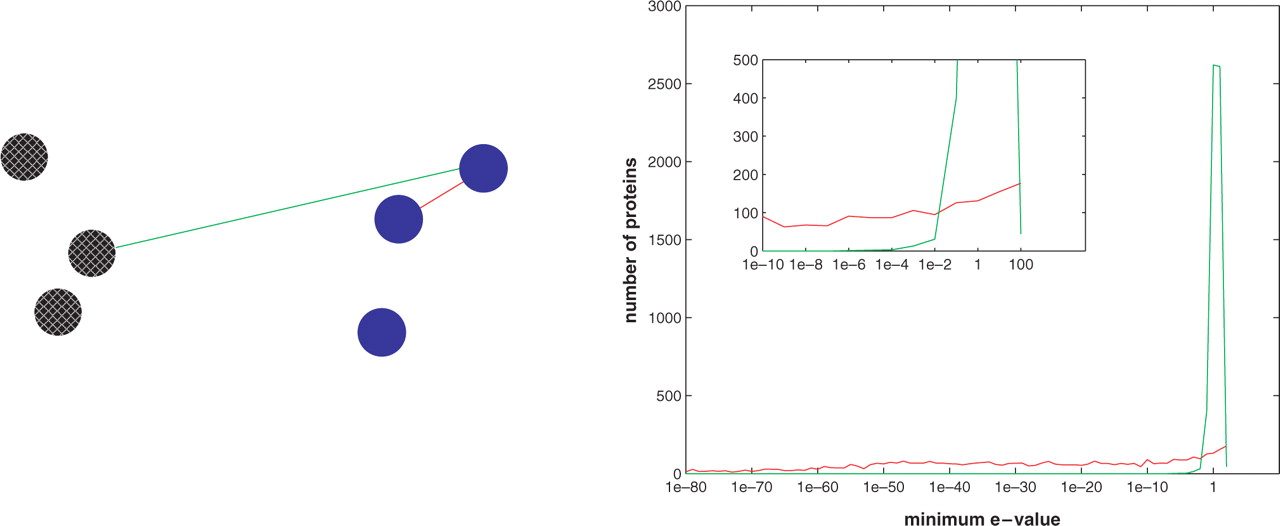
(Left)
Pictorial description of how the plot to the
right was generated. A protein is represented by a circle. Assume that
there are two super-families, identified by the two different colours,
blue (solid) and black (pattern). For each protein in turn we computed
the distance to the closest protein with the same colour (and we used
it for the red plot) and the distance to the closest protein with a
different colour (and we used it for the green plot). In the figure,
the distances used for one of the blue proteins are shown.
(Right)
Distribution of minimum E-values
within (red) and across (green) super-families in Astral-95, for E-values
between 1e–80
and 100.
[from A.
Paccanaro, J. A. Casbon, M. A. S. Saqi (2006). Spectral
Clustering of Proteins Sequences Nucleic Acids Research
2006 Mar 17;34(5):1571-80].