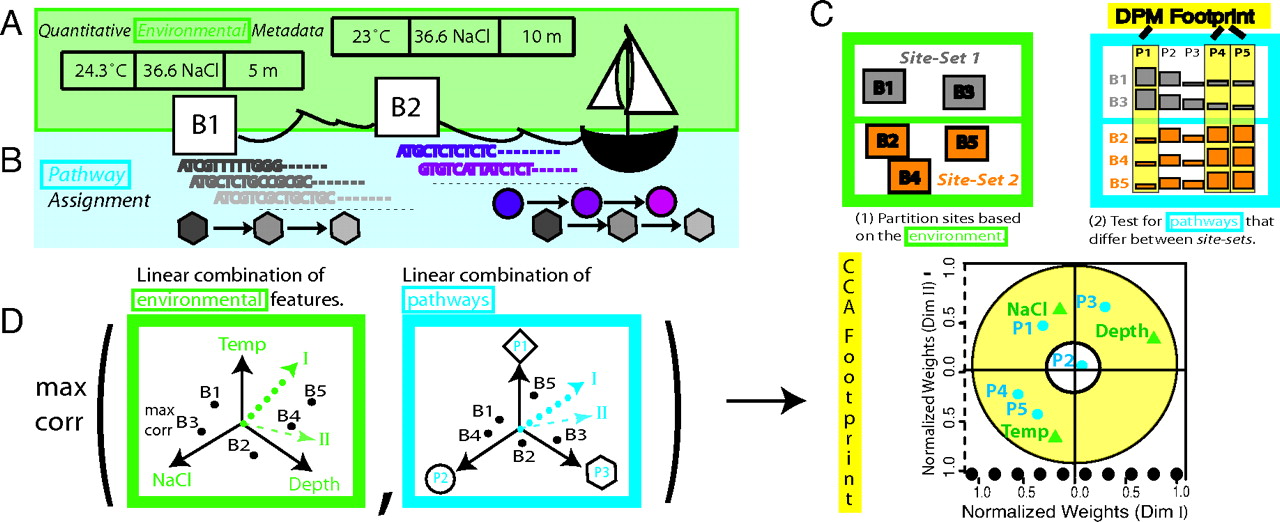
Schematic representation of approach. The large squares labeled B1, B2,
etc. represent the geographic sites (buckets). Each bucket has sequence
and environmental feature data associated with it. (A) Mapping
quantitative environmental features [salinity (ppt), sample depth
(position in water column from which the sample was collected), water
column depth (measured from surface to floor), and chlorophyll]. (B)
Metagenome-derived metabolism at different levels of resolution (see
Materials and Methods). Reads are color-coded according to their
corresponding pathway elements (shapes). Different pathways are
represented by different shapes (square, circle, etc.). All of the
instances of a particular pathway are summed and normalized to compute
the pathway score. (C) Schematic representation of DPM (see details in
text). (D) Schematic representation of CCA (see details in text).
[from T. A. Gianoulis, J.
Raes, P. V. Patel, R. Bjornson, J. O. Korbel, I. Letunic, T. Yamada, A.
Paccanaro, L. J. Jensen, M. Snyder, P. Bork, and M. B. Gerstein
Quantifying environmental adaptation of metabolic pathways in
metagenomics, Proceedings of the National Academy of Sciences, vol.
106, iss. 5, pp. 1374-1379, 2009].