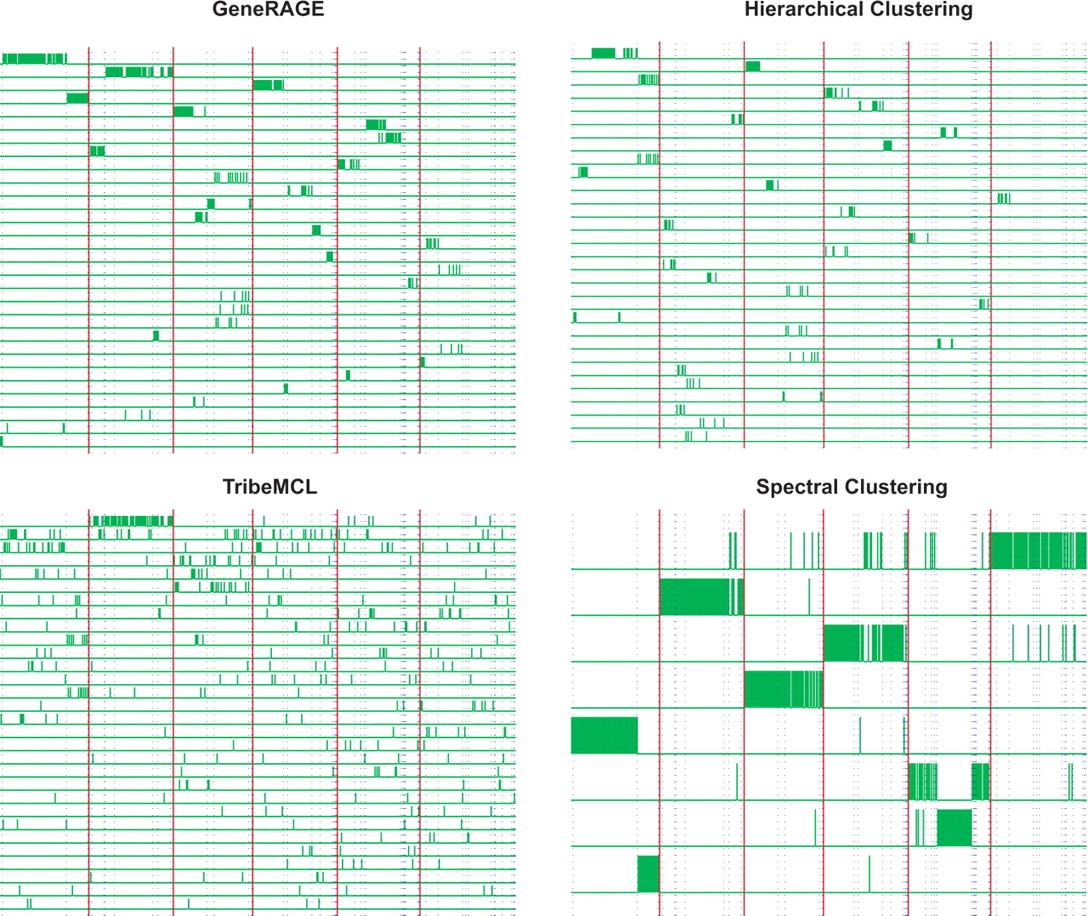
Clustering results on the 507 dataset with our implementation of
GeneRAGE (Top Left), hierarchical clustering (Top Right), TribeMCL
(Bottom Left) and our Spectral Clustering algorithm (Bottom Right). The
figures show only the top 30 most populated clusters returned by each
algorithm and 8 for the spectral clustering, since it returned only 8
clusters. Each row in the diagrams corresponds to a different cluster.
Short (green) bars represent the assignment of each protein sequence to
a cluster. Each protein has one of these bars in only one of the rows
(clusters); the presence of the bar means that the protein is assigned
to that cluster. Boundaries between super-families are shown by
vertical thick (red) lines; boundaries between families within each
super-family are shown by dotted (blue) lines. The dataset has 6
super-families, orderly from left to right: Globin-like (88), EF-hand
(83), Cupredoxins (78), (Trans)glycosidases
(83), Thioredoxin-like (81), Membrane all-alpha (94). [from A.
Paccanaro, J. A. Casbon, M. A. S. Saqi (2006). Spectral
Clustering of Proteins Sequences Nucleic Acids Research
2006 Mar 17;34(5):1571-80].