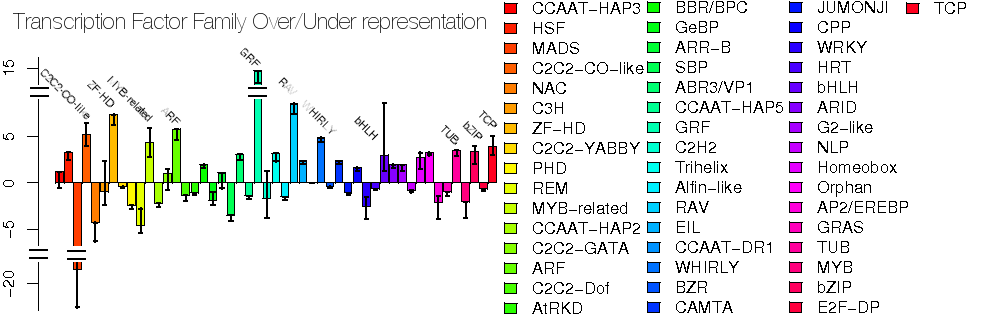
Transcription factor families
We considered families of transcription factors taken from AGRIS
and asked if each family was over or under-represented in our total set
of differentially expressed genes. The plot here uses the same
probability function determined using the Hypergeometric distribution,
where we effectively compare the ratio of the number of observed
differentially expressed genes in a given transcription factor family
to the total number of differentialy expressed transcription factors
with the ratio of all the transcription factors in the same family to
all the known transcription factors in the genome.
We note that the probes for the ATH1 affymetrix chip does not provide
full coverage of these transcription factors. This can have two
effects: in the first instance a given transcription factor family
might have a larger number of differentially expressed genes than those
measured on the Affymetrix chip. This will increase the
over-representation of that family. On the other hand, the number of
transcription factors in all the other families that are differentially
expressed could increase while the number for that given family could
remain the same. This would decrease the over-representation of that
family. We use these as an upper and lower estimate of the
systematic error due to this effect. The error bars are asymmetric and
indeed can be zero in some cases since it is possible that for a given
transcription factor family all its members are represented in the
probe set.
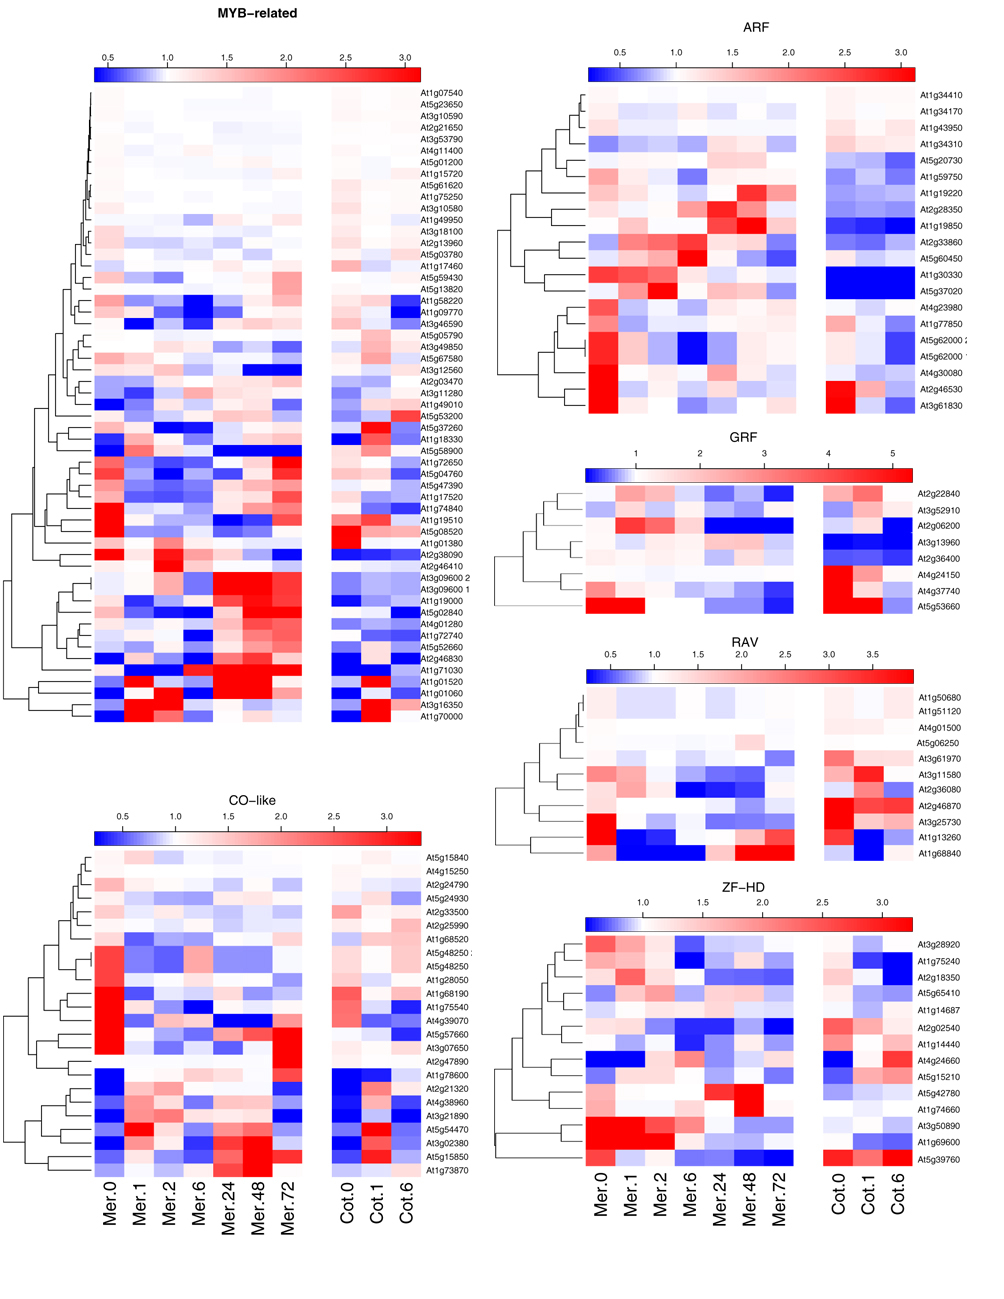
Here's a heat map of the over-represented classes :